Peak season tests both delivery speed and customer trust. When volume spikes, even small disruptions can snowball into escalations, refund requests, and client frustration. The difference between a temporary hiccup and lasting relationship damage often comes down to one thing: how customers experienced the shipping journey.
This article focuses on the metrics that shape customer perception during shipping. If you have read our guide on the 10 KPIs every 3PL and shipper should measure after peak season, you already understand the operational foundation. This article builds on that by narrowing the lens to what customers actually feel, from the moment they receive tracking information to the final delivery scan.
Why Shipping Experience Drives Customer Satisfaction
Customers judge the shipping experience on three things: predictability, clarity, and responsiveness. Satisfaction drops most when surprises happen, like late deliveries with no warning, missing scans, or exceptions that sit unresolved.
This matters because customers are watching. Research consistently shows that most consumers actively track their packages, with a significant portion checking multiple times per day. That level of attention turns in-transit performance into a real-time trust test.
While fulfillment speed shapes initial expectations, most customer perceptions form after the label prints. That is when customers are watching tracking events, expecting ETA accuracy, and deciding whether your operation feels reliable or chaotic.
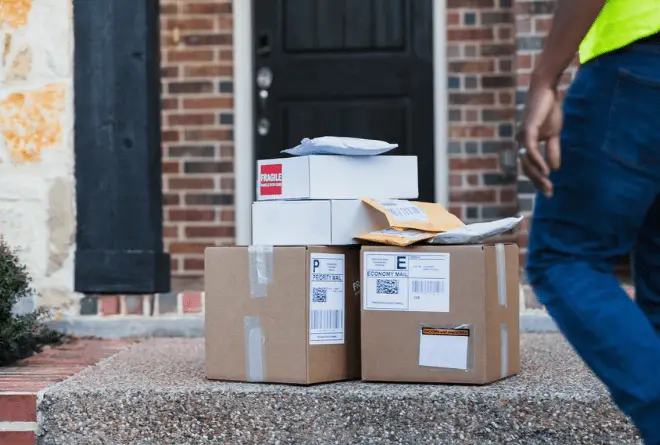
Where trust breaks most often: scan gaps that make it look like nothing is moving, late deliveries without proactive notice, and exceptions without acknowledgment. The compounding effect makes this dangerous. One poor delivery experience can trigger support volume, refunds, and retention risk. Even if peak season went well operationally, the last-mile story is often what clients remember.
The Customer Satisfaction Scorecard: Five Signal Categories
Rather than duplicating operational KPIs covered elsewhere, this scorecard focuses on what customers experience. Use it to answer a practical question: Where did the experience break down, and what should we monitor next season?
1. Delivery Promise Reliability
- This measures whether deliveries meet the date or window communicated to customers. The key is to segment by carrier, service level, and zone, because a single on-time rate can hide real risk pockets. Track on-time delivery to the promised date, variance versus baseline by carrier and service level, and late delivery concentration by lane and zone.
2. First-Attempt Delivery Success
- This tracks how often packages are delivered on the first attempt. Failed attempts create delays and frustration, and they often trigger repeated tracking checks and customer inquiries. Compare this to your own network and product mix to set lane-specific targets.
3. Exception Response Speed
- This is not just about how many exceptions happen. It is about how quickly you detect them, act on them, and resolve them. Track time from exception creation to detection, time to first action, and time to resolution by exception type. Customers do not expect instant resolution, but they do expect quick acknowledgment and a credible next step.
4. Communication Quality
- During the peak season, customers anticipate clear communication. Track the percentage of exceptions that trigger proactive notification, time from exception detection to customer-facing update, and WISMO (“where is my order”) volume trend, which is a leading indicator of satisfaction problems. When WISMO volume spikes, your communication is lagging behind customer expectations.
5. Proof-of-Delivery & Claims Signals
- These are the quality signals customers use to judge whether delivery was completed correctly. The most useful signals here are proof of delivery completeness and timeliness, delivery scan integrity, and claims or disputes tied to missing or incomplete delivery evidence.
How to Measure Customer Satisfaction in Shipping Beyond NPS
If you only measure NPS or a post-delivery survey, you will know customers were unhappy, but you won’t know the exact reasoning. The most reliable approach connects voice-of-customer signals to operational shipping signals.
A practical measurement stack includes three layers: voice-of-customer signals like CSAT, NPS, complaint themes, and WISMO contacts; in-transit experience signals like ETA accuracy, scan gaps, exception response time, and proactive notifications; and delivery outcome signals like first-attempt success, failed reason codes, and proof of delivery integrity.
Chasing down every metric here is unrealistic. Focus on isolating the few signals that predict churn and escalations, then monitor those daily when peak hits.
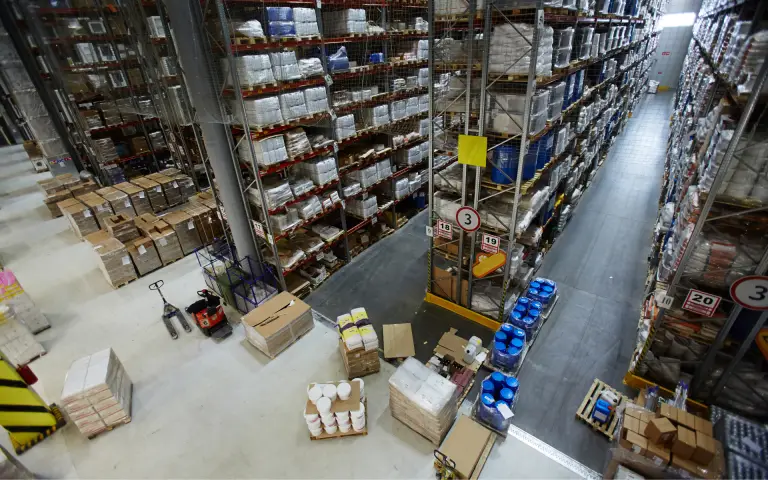
Pre-Shipment Metrics That Impact the Shipping Customer Experience
Customers start forming opinions as soon as they receive shipping confirmation. These pre-shipment signals can prevent early anxiety and reduce downstream support volume.
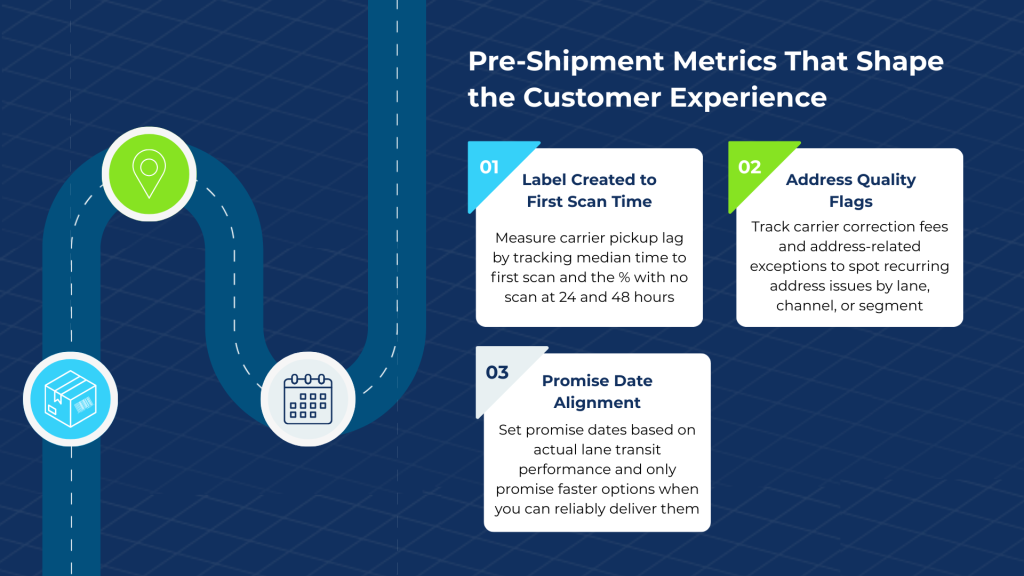
Label Created to First Scan Time
Early “no movement” anxiety happens when customers see “label created” but no carrier acceptance scan. This measures carrier pickup lag, not warehouse labor productivity. Track median time by carrier and service level, percentage of shipments with no scan after 24 hours, and percentage with no scan after 48 hours. The 48-hour threshold is often a reasonable trigger for proactive review.
Address Quality Flags
Address issues are a common root cause of failed deliveries, correction fees, and exceptions. A shipping-centric approach focuses on carrier-issued correction fees and address-related exception codes. Track address correction fees by carrier and lane, address-related exception rate trends, and repeat issue concentration by channel or customer segment. Carrier tracking events and correction fees can reveal patterns that are easy to miss when you only look at customer complaints.
Promise Date Alignment
Overpromising is one of the fastest ways to damage the shipping customer experience. The process of aligning promise dates involves choosing service levels that correspond with realistic carrier transit expectations for a given route. If a carrier delivers to a distant zone in five days most of the time, do not promise three-day delivery for that lane unless you have a proven alternative.
Exception Handling and Customer Satisfaction
Exceptions are inevitable during peak. However, your response speed determines whether they damage relationships.
Exception Rate by Type
Start by categorizing exceptions so you can tell the difference between systemic issues and one-off disruptions. Common categories include weather delays, carrier capacity issues, incorrect addresses, and delivery access failures. Categorizing exceptions helps identify patterns, and by tracking which exception types are increasing week over week, you will catch emerging problems before they escalate.
Time to First Action
Time to first action measures the gap between exception creation and someone touching it. This is typically the most critical customer satisfaction metric for exceptions. Again, communication is key, and customers need acknowledgment.
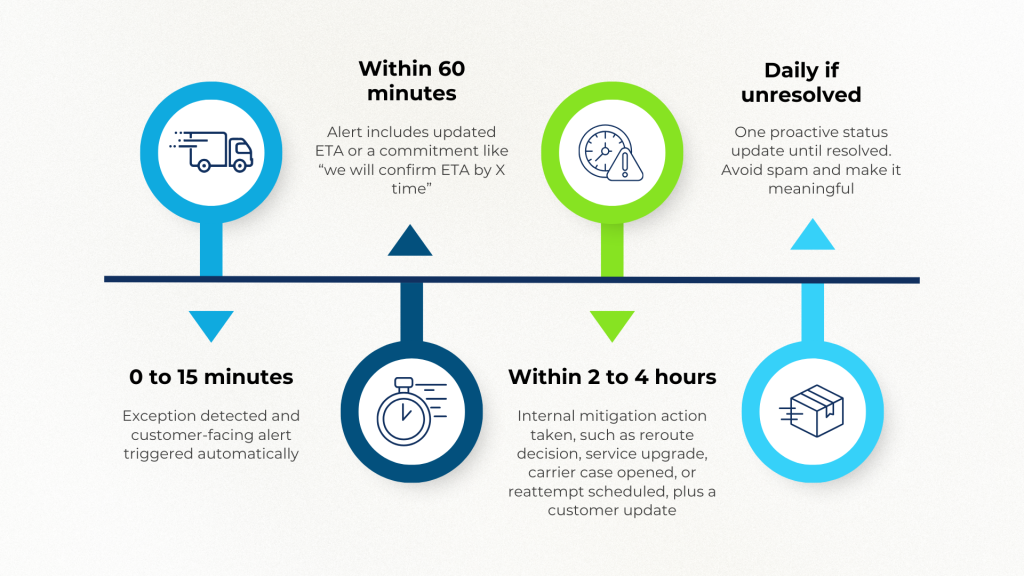
Use these benchmarks as a starting point:
- 0 to 15 minutes: Exception detected and customer-facing alert triggered automatically
- Within 60 minutes: Alert includes updated ETA or a commitment like “we will confirm ETA by X time”
- Within 2 to 4 hours: Internal mitigation action taken, such as reroute decision, service upgrade, carrier case opened, or reattempt scheduled, plus a customer update
- Daily, if unresolved: One proactive status update until resolved. Avoid spam and make it meaningful
The first action can take several forms: a status update, a customer notification, carrier follow-up, or an internal escalation. The key is to handle the issue quickly.
Time to Resolution
Full resolution time varies by exception type. Weather delays and address issues have different resolution profiles. Rather than tracking a single average, focus on what percentage are resolved within 24 hours and what percentage are resolved within 48 hours. Also, measure whether the resolution actually fixed the problem and not just the speed of closing the ticket.
Proactive Notification Rate
Did you reach out before the customer asked? This is often the difference between retention and churn. Track the percentage of exceptions in which the customer received a notification before contacting you.
The difference between recovering trust and losing a customer often comes down to just hours, not days. Systems that automatically flag exceptions and trigger workflow alerts help teams respond faster. If a weather delay affects 200 shipments, rule-based notifications can inform customers immediately rather than waiting for individual inquiries. This transforms a potential crisis into a managed situation.
Monitoring the Shipping Customer Experience in Real Time
This is the bridge from post-peak analysis to in-season execution. You do not improve customer satisfaction by reading a retrospective once. You improve it by turning insights into actions.
Daily Monitoring During Peak
Daily monitoring helps you catch issues early enough to act before customers escalate. Watch the exception creation rate, especially when trending up. Track first-attempt delivery success as an early warning on lane and address issues. Monitor scan gap detection for shipments with no movement for more than 48 hours. And track WISMO volume trend as a leading indicator of satisfaction problems.
Weekly Monitoring
Weekly monitoring helps you spot patterns that require broader process changes. Review carrier performance trends by service level and zone. Track address-correction patterns and recurring data-quality issues. Ensure you continuously monitor claims and dispute trends by carrier and shipment profile, and compare on-time delivery variances against baseline performance.
Platforms that integrate carrier data, track events in real time, and support rule-based alerts help teams shift from reactive service to proactive experience management.
When your system detects issues before customers do, you maintain trust even when carriers underperform.
Key Metrics for Lasting Shipper & 3PL Customer Satisfaction
If you want to improve shipper & 3PL customer satisfaction, focus on the moments customers feel most intensely: reliable delivery promises, clear visibility, and fast response when something goes wrong. Reliable deliveries come from fewer failed attempts and clearer communication. Proactive updates keep customers in the loop before issues escalate. When exceptions happen, fast response and complete resolution matter the most.